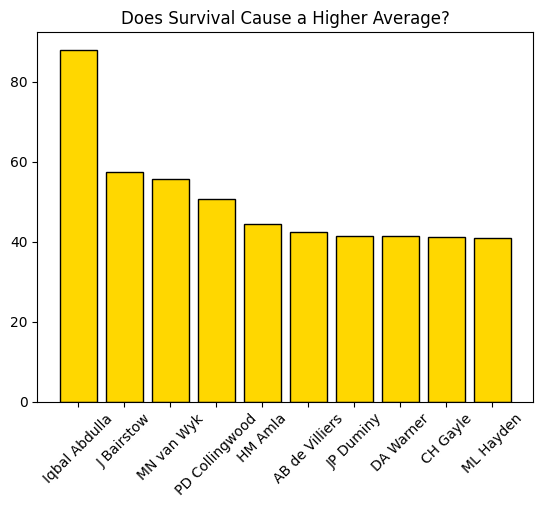
Does Staying in the Game Help Your Average?
This bar chart shows the 10 players with the best career averages, like Iqbal Abdulla and J Bairstow. The average is found by taking all the runs a player made and dividing it by how many times they got out. This graph shows that players who are careful and stay in the game for a long time (survival) usually end up with much better scores than players who take too many risks.
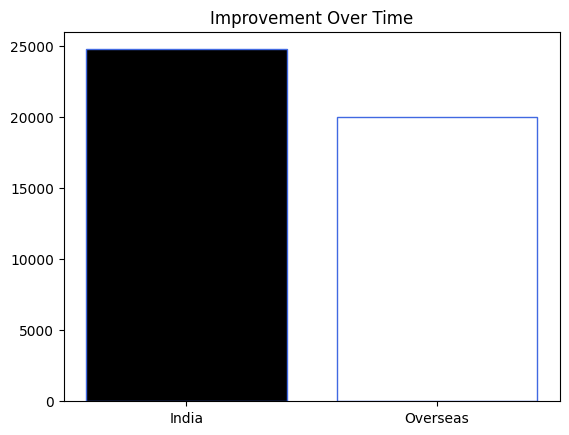
Who Scores More: India or Other Countries?
This chart compares the total runs made by the best Indian players against the best players from other countries. In this data, the Indian group made almost 25,000 runs, which was more than the overseas group. This helps us see "Home Advantage," which means players might score more runs when they play in their own country on ground they are used to.
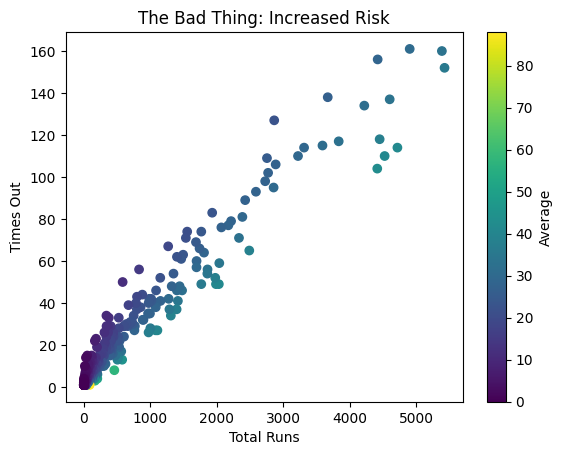
The Cost of Scoring: More Runs, More Risk
This scatter plot shows that as a player scores more runs in their career, they also get out more often. Every dot is a player, and the color shows their batting average. It shows the "Survival Paradox," because even though everyone eventually gets out, the very best players find a way to keep their average high even after playing for a long time and getting out a lot.